Research

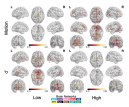
Spatial extent inference (SEI) is widely used across neuroimaging modalities to adjust for multiple comparisons when studying brain-phenotype associations that inform our understanding of disease. Recent studies have shown that Gaussian random field (GRF) based tools can have inflated family-wise error rates (FWERs).

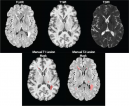
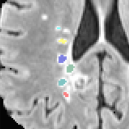
Magnetic resonance imaging (MRI) is crucial for in vivo detection and characterization of white matter lesions (WML) in multiple sclerosis (MS). However, not all WML are alike - some show more severe imaging signatures indicative of worse demyelination and axonal loss. Detecting these lesions using artificial intelligence has proved difficult.

In neuroimaging, hundreds to hundreds of thousands of tests are performed across a set of brain regions or all locations in an image. Recent studies have shown that the most common family-wise error (FWE) controlling procedures in imaging, which rely on classical mathematical inequalities or Gaussian random field theory, yield FWE rates (FWER) that are far from the nominal level.

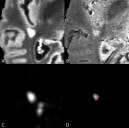
The central vein sign (CVS) is a promising MR imaging diagnostic biomarker for multiple sclerosis, yet the clinical application of the central vein sign as a biomarker is limited by the time burden required for the manual determination of CVS for each lesion in a patient's full MRI scan. In this study, we present an automated technique for the detection of the central vein sign in white matter lesions. The proposed algorithm showed strong discriminative ability between patients with and without MS, representing a step towards more feasible clinical implementation of CVS.

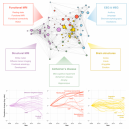
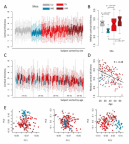
As the field of neuroimaging grows, it can be difficult for researchers to maintain a detailed understanding of its changing landscape. In this work, we apply techniques from network science to map the landscape of neuroimaging research over the past decade. Broadly, this study presents a cohesive model for understanding the relationships between topics in the field, and discusses the changing popularity and structural roles of different research areas over time.

In the fields of neuroimaging and genetics, a key goal is testing the association of a single outcome with a very high-dimensional imaging or genetic variable. Often, summary measures of the high-dimensional variable are created to sequentially test and localize the association with the outcome. In some cases, the associations between the outcome and summary measures are significant, but subsequent tests used to localize differences are underpowered and do not identify regions associated with the outcome. 

MIMoSA: we have developed a fully automatic lesion segmentation algorithm which utilizes novel covariance features from inter-modal coupling regression in addition to mean structure to model the probability lesion is contained in each voxel.

Lesion load is a common biomarker in multiple sclerosis, yet it has historically shown modest association with clinical outcome. Lesion count, which encapsulates the natural history of lesion formation and is thought to provide complementary information, is difficult to assess in patients with confluent (ie, spatially overlapping) lesions. We introduce a statistical technique for cross-sectionally counting pathologically distinct lesions.

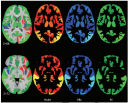
With the proliferation of multi-site neuroimaging studies, there is a greater need for handling non-biological variance introduced by differences in MRI scanners and acquisition protocols. Such unwanted sources of variation, which we refer to as "scanner effects", can hinder the detection of imaging features associated with clinical covariates of interest and cause spurious findings. In this paper, we investigate scanner effects in two large multi-site studies on cortical thickness measurements across a total of 11 scanners.

Diffusion tensor imaging (DTI) is a well-established magnetic resonance imaging (MRI) technique used for studying microstructural changes in the white matter. As with many other imaging modalities, DTI images suffer from technical between-scanner variation that hinders comparisons of images across imaging sites, scanners and over time.

ABOUT PENNSIVE

The Penn Statistics in Imaging and Visualization Endeavor (PennSIVE) consists of a group of statisticians studying etiology and clinical practice through medical imaging. 

LOCATION

2nd Floor, Blockley Hall
University of Pennsylvania
423 Guardian Drive
Philadelphia, PA 19104-6021

  

SOCIAL MEDIA